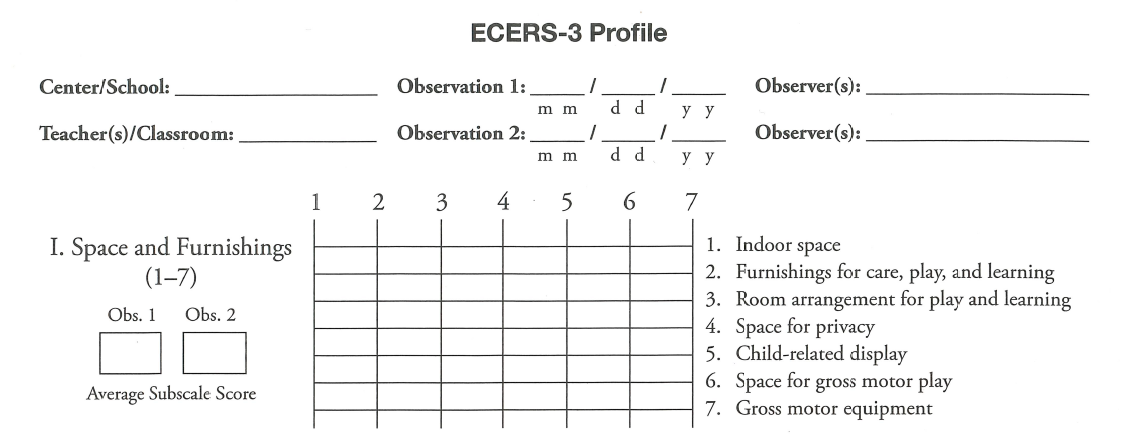
Completing the ERS Profile
Now that all items have been scored, complete the ERS Profile, which is at the end of the scoresheet.

Flip back to Indoor space and mark the score for this item.
Do the same for each indicator until you have copied the score for every item into the profile.
Now, average the scores for each sub-scale. To to average Space and Furnishings, add the item score and then divide that number by 7.
In the example below, the center scored 1, 2, 3, 2, 2, 6 and 1; so

1 + 2 + 3 + 2 + 2 + 6 + 1 = 17
17 / 7 = 2.43
2.43 is the average subscale score for Spaces and Furnishings. Enter the average subscale score in the last table in the profile.

Continue computing average subscale scores and marking them in the last table.

Once you’ve filled in the entire average subscale scores table, you can find the average for the entire scale. In my example, the average subscale scores were 2.43, 1.75, 3.20, 2.72, 2.00 and 2.33. Add these scores together and divide by 6.
2.43 + 1.75 + 3.20 + 2.72 + 2.00 + 2.33 = 14.43
14.43 / 6 = 2.41
2.41 is the average for this classroom.
